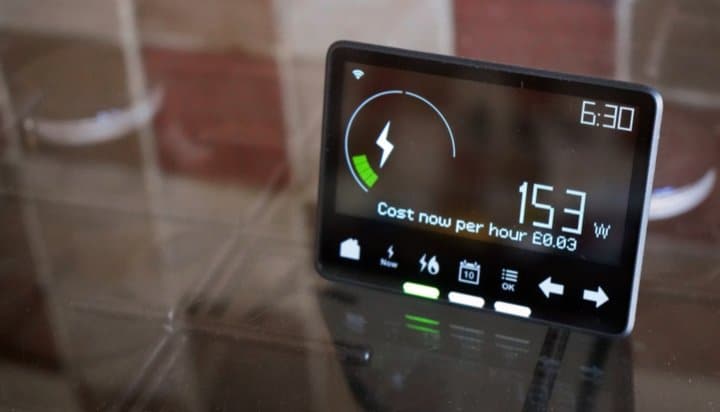
A meter is an ideal visual tool to indicate the progress of a project, the usage of a resource, or the level of achievement. It is one of the most useful items on a dashboard.
If you know graphic designs and some visual basic codes, it is not too difficult to make one.
You need to first create a meter. A meter is actually composed of 2 items: the readings background and the pointer. The readings background is a non-moving component. The pointer is floating on top of it. The pointer is moved by the visual basic codes using the rotation property of a graphical item.

In my attached file, I compare the actual sales figure with the targeted sales to calculate the percentage of achievement. The percentage of achievement is then shown up on the meter.

The percentage of achievement is supposed to be from 0% to indefinite, but the meter only shows up to 100%, so any percentage of achievement exceeds 100% will be capped to 100%. Then the percentage of achievement must be converted to meter readings. Since the meter is designed as a half circle, it has 180 degree. Therefore, the percentage of achievement will multiply 180 in the calculation. Below are the visual basic codes to make the pointer rotate to the correct position.

Please note that I named the pointer graphic as “Pointer”. The naming is necessary to have the visual basic codes known which graphic to rotate.
The next step is to automate the rotation. I would like to have the pointer moved immediately once the input figures or the calculated figures are changed instead of having to press a button. So I inserted the visual basic codes to do the work automatically. Please note that I defined the range of values of “Actual Sales”, “Target Sales”, and “Achievement” as “Variables”. So whatever numbers in those 3 variables changed by the user will automatically trigger the movement of the pointer.

Please note that the codes must be placed under the worksheet where the meter is placed.
Below are the entire visual basic codes for the meter:

AchieveValue = Range(“Achieve”).Value
If AchieveValue > 1 Then
Score = 180
Else
Score = AchieveValue * 180
End If
With ActiveSheet.Shapes(“Pointer”)
.Rotation = Score
End With
Private Sub Worksheet_Change(ByVal Target As Range)
If Not Intersect(Target, Me.Range(“Variables”)) Is Nothing Then
………
End If
End Sub
Private Sub Worksheet_Change(ByVal Target As Range)
Dim Score As Single
Dim AchieveValue As Single
‘Whenever the cell “Achieve” is changed, the pointer of the meter will be automatically changed
If Not Intersect(Target, Me.Range(“Variables”)) Is Nothing Then
AchieveValue = Range(“Achieve”).Value
If AchieveValue > 1 Then
Score = 180
Else
Score = AchieveValue * 180
End If
With ActiveSheet.Shapes(“Pointer”)
.Rotation = Score
End With
End If
End Sub
Below is the final report.